Recipe 1: Extract reads by coverage
The below is a recipe for computing coverage spectra and slicing reads out of a data set based on their coverage, with no assembly required.
Uses for extracting reads by coverage include isolating repeats or pulling out mitochondrial DNA. This approach won’t work on digitally normalized reads, and is primarily intended for genomes and low-complexity metagenomes. For high-complexity metagenomes we recommend partitioning.
Note: at the moment, the khmer script slice-reads-by-coverage is
on the master branch of the khmer repository, but not in any numbered
release. Once we’ve merged it into the master branch and cut a
release, we’ll remove this note and simply specify the khmer release
required.
Let’s assume you have a simple genome with some 5x repeats, and you’ve
done some shotgun sequencing to a coverage of 150. If your reads are
in reads.fa, you can generate a k-mer spectrum from your genome
with k=20:
load-into-counting.py -x 1e8 -k 20 reads.kh reads.fa
abundance-dist.py -s reads.kh reads.fa reads.dist
./plot-abundance-dist.py reads.dist reads-dist.png --ymax=300
and it would look something like this:
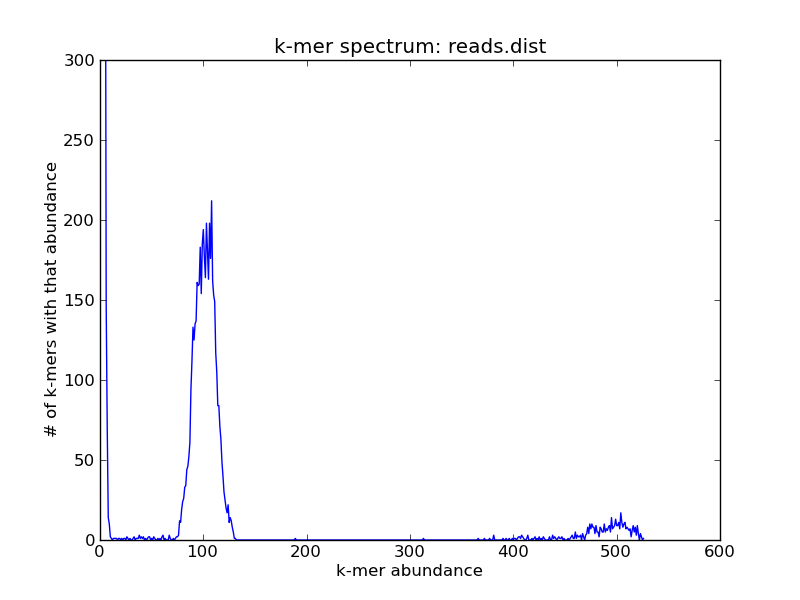
For this (simulated) data set, you can see three peaks: one on the far right, which contains the high-abundance k-mers from your repeats; one in the middle, which contains the k-mers from the single-copy genome; and one all the way on the left at ~1, which contains all of the erroneous k-mers.
This is a useful diagnostic tool, but if you wanted to extract one peak or another, you’d have to compute a summary statistic of some sort on the reads. The khmer package includes just such a ‘read coverage’ estimator. On this data set, the read coverage spectrum can be generated like so::
~/dev/khmer/sandbox/calc-median-distribution.py reads.kh reads.fa reads-cov.dist
./plot-coverage-dist.py reads-cov.dist reads-cov.png --xmax=600 --ymax=500
and looks like this:
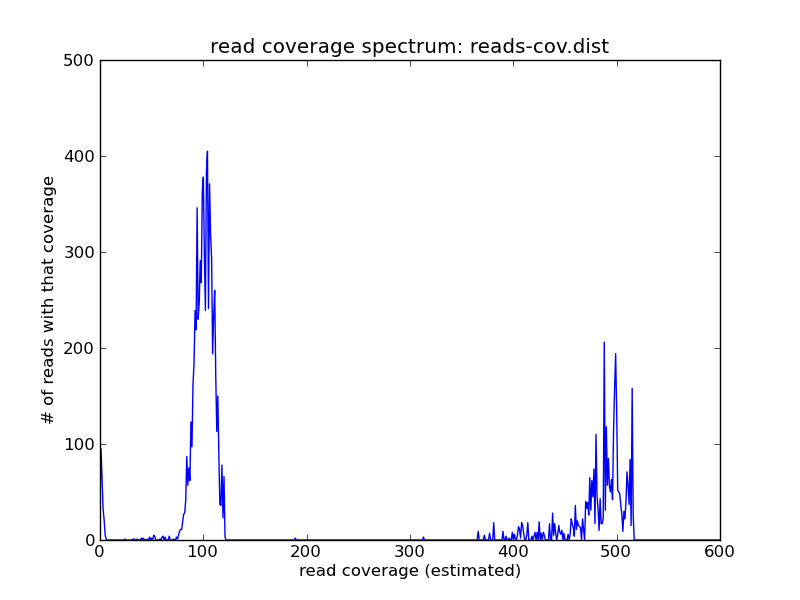
You see the same peaks at roughly the same places. While superficially similar to the k-mer spectrum, this is actually more useful in its own right – because now you can grab the reads and do things with them.
We provide a script in khmer to extract the reads;
slice-reads-by-coverage will take either a min coverage, or a max
coverage, or both, and extract the reads that fall in the given
interval.
First, let’s grab the reads between 50 and 200 coverage – these are the single-copy genome components. We’ll put them in reads-genome.fa.
~/dev/khmer/sandbox/slice-reads-by-coverage.py reads.kh reads.fa reads-genome.fa -m 50 -M 200
Next, grab the reads greater in abundance than 200; these are the repeats. We’ll put them in reads-repeats.fa.
~/dev/khmer/sandbox/slice-reads-by-coverage.py reads.kh reads.fa reads-repeats.fa -m 200
Now let’s replot the read coverage spectra, first for the genome:
load-into-counting.py -x 1e8 -k 20 reads-genome.kh reads-genome.fa
~/dev/khmer/sandbox/calc-median-distribution.py reads-genome.kh reads-genome.fa reads-genome.dist
./plot-coverage-dist.py reads-genome.dist reads-genome.png --xmax=600 --ymax=500
and then for the repeats:
load-into-counting.py -x 1e8 -k 20 reads-repeats.kh reads-repeats.fa
~/dev/khmer/sandbox/calc-median-distribution.py reads-repeats.kh reads-repeats.fa reads-repeats.dist
./plot-coverage-dist.py reads-repeats.dist reads-repeats.png --xmax=600 --ymax=500
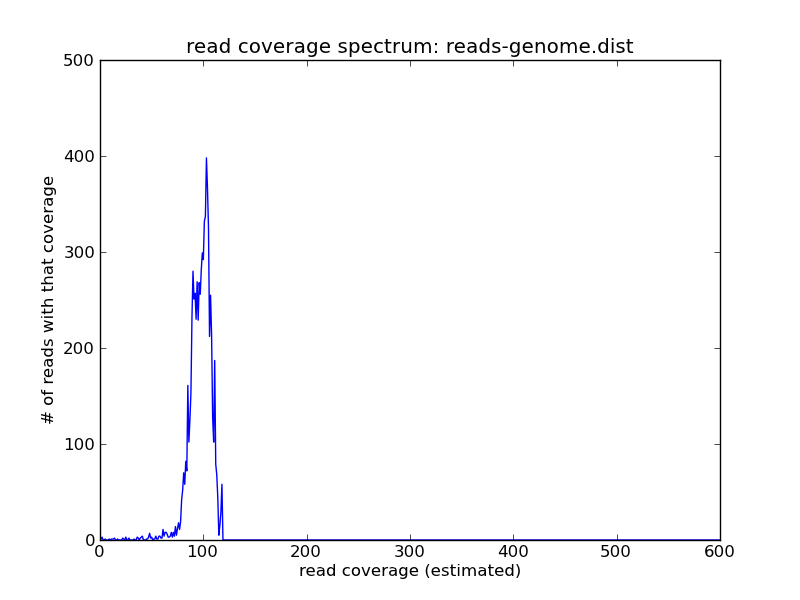
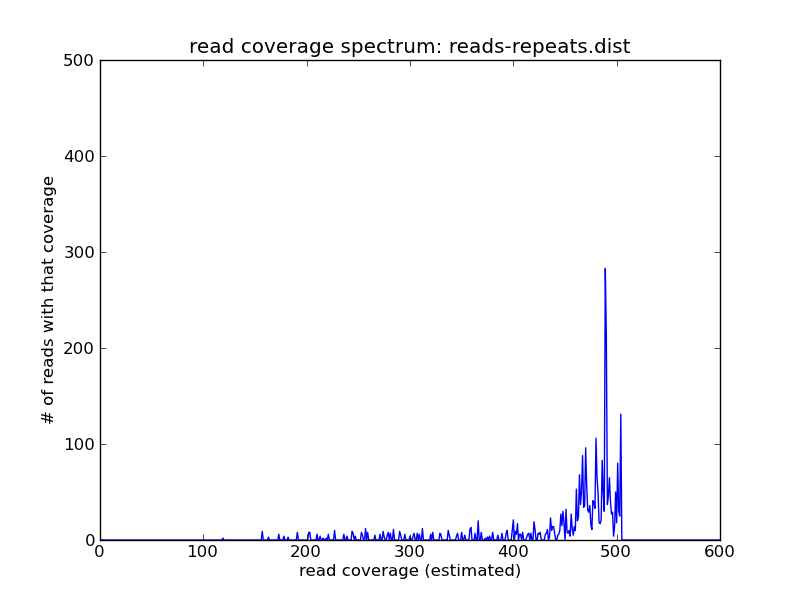
and voila! As you can see we have the reads of high coverage in
reads-repeats.fa, and the reads of intermediate coverage in
reads-genome.fa.
If you look closely, you might note that some reads seem to fall outside the specified slice categories above – that’s presumably because their coverage was predicated on the coverage of other reads in the whole data set, and now that we’ve sliced out various reads their coverage has dropped.
Resources and Links
This recipe is hosted in the khmer-recipes repository, https://github.com/ged-lab/khmer-recipes/.
It requires the khmer software.
LICENSE: This documentation and all textual/graphic site content is licensed under the Creative Commons - 0 License (CC0) -- fork @ github.
comments powered by Disqus